Average vs. Median Salary by State: What a Typical Paycheck Really Looks Like
Nov 03, 2026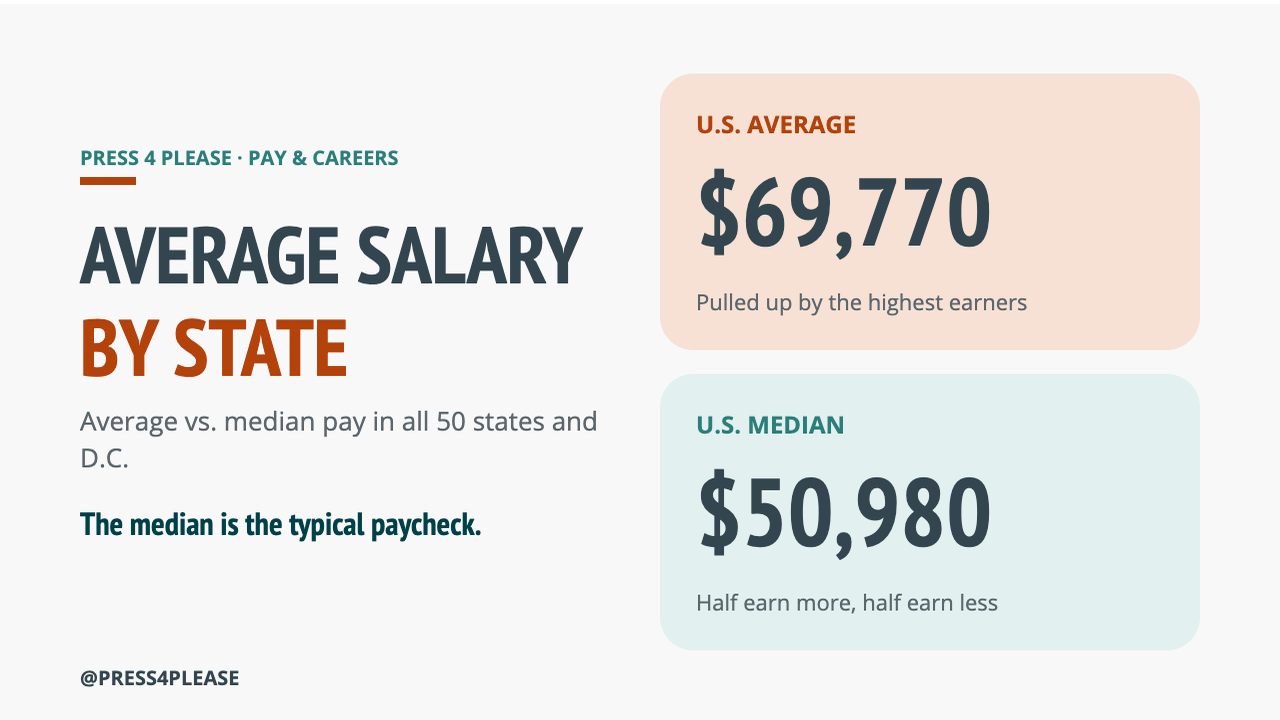
Ever look up the "average salary" in your state and think, that's not what anyone I know makes? You're not imagining it. The average and the median tell two different stories, and knowing the difference helps you judge a job offer, ask for a raise or plan a move.
Average vs. median, in plain English
- Average (mean): add up everyone's pay, then divide by the number of workers.
- Median: the middle paycheck. Half of workers earn more, and half earn less.
Here's why they differ. Say five people earn $40,000, $45,000, $50,000, $55,000 and $310,000. The average is $100,000. The median is $50,000. One big paycheck doubled the average, but the median didn't move. That's why the median is usually closer to what a typical worker earns.
The national picture
Across the U.S., the average annual wage is $69,770 and the median is $50,980 (U.S. Bureau of Labor Statistics, May 2025). In every state, and in D.C., the average is higher than the median.
Highest median pay
- Massachusetts: $63,590 median ($85,610 average)
- Washington: $62,990 median ($83,330 average)
- Alaska: $61,000 median ($74,720 average)
- Colorado: $59,800 median ($77,190 average)
- Connecticut: $59,690 median ($77,420 average)
Washington, D.C. tops them all with a $91,540 median.
Lowest median pay
- Mississippi: $40,120 median ($50,810 average)
- Arkansas: $43,630 median ($54,890 average)
- West Virginia: $45,300 median ($56,470 average)
- Louisiana: $45,520 median ($56,600 average)
- Oklahoma: $45,600 median ($56,950 average)
Lower pay often comes with a lower cost of living, so a smaller paycheck can stretch further.
Where the gap is biggest
The gap shows how unevenly pay is spread. In California, the average ($80,690) is about 39% higher than the median ($58,240). New York (38%), Illinois (37%), Georgia (37%) and Texas (35%) follow. The smallest gaps are in D.C., North Dakota and South Dakota, at about 21% to 22%.
Every state at a glance
| State | Average | Median |
|---|---|---|
| Alabama | $57,500 | $45,670 |
| Alaska | $74,720 | $61,000 |
| Arizona | $67,620 | $50,060 |
| Arkansas | $54,890 | $43,630 |
| California | $80,690 | $58,240 |
| Colorado | $77,190 | $59,800 |
| Connecticut | $77,420 | $59,690 |
| Delaware | $69,880 | $52,190 |
| District of Columbia | $111,010 | $91,540 |
| Florida | $64,670 | $47,880 |
| Georgia | $65,920 | $48,170 |
| Hawaii | $70,270 | $56,320 |
| Idaho | $61,170 | $47,970 |
| Illinois | $71,130 | $51,960 |
| Indiana | $60,840 | $47,860 |
| Iowa | $59,830 | $48,540 |
| Kansas | $60,640 | $48,010 |
| Kentucky | $58,990 | $46,920 |
| Louisiana | $56,600 | $45,520 |
| Maine | $65,780 | $51,430 |
| Maryland | $77,580 | $59,510 |
| Massachusetts | $85,610 | $63,590 |
| Michigan | $64,920 | $49,270 |
| Minnesota | $71,160 | $56,920 |
| Mississippi | $50,810 | $40,120 |
| Missouri | $62,160 | $47,800 |
| Montana | $60,880 | $48,740 |
| Nebraska | $62,400 | $48,980 |
| Nevada | $62,050 | $47,660 |
| New Hampshire | $71,360 | $55,880 |
| New Jersey | $78,040 | $58,570 |
| New Mexico | $62,330 | $47,210 |
| New York | $82,460 | $59,670 |
| North Carolina | $64,290 | $47,970 |
| North Dakota | $64,050 | $52,480 |
| Ohio | $64,390 | $49,380 |
| Oklahoma | $56,950 | $45,600 |
| Oregon | $72,460 | $57,000 |
| Pennsylvania | $65,730 | $49,690 |
| Rhode Island | $71,900 | $56,780 |
| South Carolina | $59,280 | $46,490 |
| South Dakota | $57,610 | $47,080 |
| Tennessee | $60,800 | $47,380 |
| Texas | $65,750 | $48,620 |
| Utah | $66,290 | $50,110 |
| Vermont | $69,050 | $56,390 |
| Virginia | $74,040 | $55,690 |
| Washington | $83,330 | $62,990 |
| West Virginia | $56,470 | $45,300 |
| Wisconsin | $64,270 | $50,270 |
| Wyoming | $61,560 | $50,270 |
| U.S. overall | $69,770 | $50,980 |
How to use these numbers
- Use the median as your yardstick. It's closer to a typical paycheck than the average.
- Get specific. Look up the median for your job and your city, not just your state. The BLS Occupational Employment and Wage Statistics tool lets you search by both.
- Weigh pay against costs. Rent, taxes and everyday prices can matter as much as the number on your paycheck.
The takeaway
The "average" salary is pulled up by the highest earners. If you want to know what a typical paycheck looks like, look at the median.
Follow @press4please for more simple money lessons.
Source: U.S. Bureau of Labor Statistics, Occupational Employment and Wage Statistics, May 2025. Annual wages for all occupations; figures cover wage and salary workers and exclude the self-employed. This article is for general information only and isn't financial advice.
Want a head start?
Grab the free zero-based budget spreadsheet: give every dollar a job before the month starts.